Econocasts

Tuesday, December 27, 2016

2016.12.27 XOI.X Cycle Model Chart

2016.12.27 XOI.X Cycle Model Chart


The predictive curve shifted to the right, but the index also increased in magnitude so that that the Z-score is now much less than indicated in the previous month's chart. The previous iteration is shown below, which is also found here on the blog.

2016.11.26 XOI.X Cycle Model Chart


Monday, December 5, 2016

2016.12.02 Silver Cycle Model Chart

2016.12.02 Silver Cycle Model Chart


The predictive curve is far ahead of the actual price and the right phase shift has ended. A similar dissonance is seen in the recent gold and XOI.X cycle models. If the model is valid, the dissonance should resolve in the next four weeks with a rise in the silver price.

2016.12.02 Gold Cycle Model Chart

2016.12.02 Gold Cycle Model Chart


This looks a bit like the XOI.X cycle model with its continued rightward phase shift. The predictive curve had a major inflection point in early November.  Looking at the Z-score, the previous record high of 5.47 occurred on March 18, 1980. The current Z-score is 4.86. If the model is still valid, over the next four weeks the actual price should approach the predictive curve.  Previous iterations of the model are found below on the blog.

Saturday, November 26, 2016

2016.11.26 XOI.X Cycle Model Chart

2016.11.26 XOI.X Cycle Model Chart


The rightward phase shift continues, and the model is predicting higher values for the index going forwards. Previous iterations of the model are shown below on the blog.  I mentioned in a post below that my USO neural net trading model, which suggests trades about 6 times a year just went on Buy on 11/17/2016. I will post when it goes to Sell.

Monday, October 24, 2016

2016.10.24 XOI.X Cycle Model Chart

XOI.X Cycle Model Chart


The phase change to the right continues, though the pace may have slowed down. There is some information to be gathered from the predicted magnitude suggesting that going forwards, prices much lower than the current levels are highly unlikely. A previous iteration of the model is shown below and here on the blog.


2016.09.27 XOI.X Cycle Model Chart

Sunday, October 16, 2016

2016.10.14 NASDAQ Cycle Model Chart

2016.10.14 NASDAQ Cycle Model Chart


The model suggests we may have seen the peak for the index for a while, and it occurred a few weeks later than model prediction. A previous run of the model is shown below and here on the blog.


2016.09.02 NASDAQ Cycle Model Chart

Thursday, October 6, 2016

2016.10.05 Gold Cycle Model Chart

2016.10.05 Gold Cycle Model Chart


A major divergence between the predicted price and actual price has occurred, but there is no rightward phase shift in the predictive curve at the moment.  Looking back at the model history, this level of divergence where the Z-score exceeded 3.77 occurred a few times.  In 1973.08.15, 1974.07.04, and 1980.03.27.  On all those occasions, the actual price resolved to the upside within a six week period.  So, the model may be broken, always a possibility, or a similar historical reversion will occur within a short time period.  A previous model run is shown below and here on the blog.

2016.08.12 Gold Cycle Model Chart

Thursday, September 29, 2016

2019.09.28 Silver Cycle Model Chart

2016.09.28 Silver Cycle Model Chart


The silver cycle model correctly predicted a decrease in price right after the model run shown below, and here on the blog.  Of interest, the model is not showing a phase shift in time, but a magnitude shift in price. If the model is correct, we should see a local minimum in price some time in the next month, followed by a rising price into 2017.  Of course, remembering that all models are wrong, but some are useful.


2019.08.12 Silver Cycle Model Chart

Wednesday, September 28, 2016

2016.09.27 XOI.X Cycle Model Chart

2016.09.27 XOI.X Cycle Model Chart


The XOI.X model shows a continued right phase shift, and a major discordance between the predicted and actual index level. I note that a similar discordance occurred twice before, with Z-score > 6, on 1987.10.19 and 2008.10.15.  Both times the index resolved to the upside within 6 weeks.A previous chart of the model output is shown below and here on the blog.


2016.08.22 XOI.X Cycle Model Chart

Friday, September 23, 2016

2016.09.23 DJIA Cycle Model Chart

2016.09.23 DJIA Cycle Model Chart


The rightward phase shift continues, though still suggesting lower prices for the average.  This is not surprising given the model uses data going back to 1896. There are a few multidecadal cycles for which a year or two of variance is well within error. Summing up: the chance for a price reversion is high, but so is the chance of QE 4,5 and 6! My biased view is that the model shows the kinds of cyclical pressures that the Fed is avoiding with its countercyclical monetary policies, with much success as measured by the DJIA price, for now.

Monday, September 5, 2016

2016.09.02 NASDAQ Cycle Model Chart

2016.09.02 NASDAQ Cycle Model Chart


I posted this a bit earlier than usual because the NASDAQ cycle model is not experiencing a right phase shift at the moment, but seems to indicate that a major top may be forming given the predictive curve.  If in the next few weeks NASDAQ begins to descend, the model suggests much lower prices going into Spring 2017.  A reminder that all models are wrong but some are useful.  Previous iterations of the model are found below and here and here on the blog.


2016.08.19 NASDAQ Cycle Model Chart


2016.07.29 NASDAQ Cycle Model Chart

Monday, August 22, 2016

2016.08.22 XOI.X Cycle Model Chart

2016.08.22 XOI.X Cycle Model Chart


The cycle model is exhibiting a right phase shift which has flattened the predictive curve. Nevertheless, the model suggests some upward pressure on prices going into the Fall and through the end of the year. A previous iteration of the model is shown below and here on the blog.


2016.06.03 XOI.X Cycle Model Chart

Sunday, August 21, 2016

2016.08.19 NASDAQ Cycle Model Chart

2016.08.19 NASDAQ Cycle Model Chart


It is very unusual in this type of cycle model that the predictive price curve and actual price curve remain so tightly aligned over time. The model strongly suggests a turning point in the NASDAQ may occur in the September 1, 2016 time frame.  The previous iteration of the cycle model is seen below and here on the blog.


2016.07.29 NASDAQ Cycle Model Chart
 

Sunday, August 14, 2016

2016.08.14 Silver Cycle Model Chart

2016.08.12 Silver Cycle Model Chart


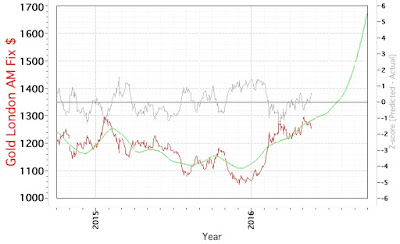
The silver cycle model suggests that silver prices are looking towards a minor correction over the next few months.  As with the gold price cycle model, the rightward phase shift seems to have ended, and the model, for now, is in the groove, which is a meta-technical term. Note the correct prediction of a reversal when the Z-score approached -2.5.  A previous iteration of the model is shown below and here on the blog.


2016.07.01 Silver Cycle Model Chart

Friday, August 12, 2016

2016.08.12 Gold Cycle Model Chart

2016.08.12 Gold Cycle Model Chart


The gold cycle model seems to be "in the groove" as the right phase shifting of the predictive curve is played out at the moment. Readers may recall this is what occurred with the XOI.X model, which then proved to be fairly robust thereafter.  That said, recall the motto: "All models are wrong but some are useful."  A previous iteration of the model is shown below and here on the blog.


2016.06.24 Gold Cycle Model Chart

Sunday, July 31, 2016

2016.07.29 Nasdaq Cycle Model Chart

2016.07.29 Nasdaq Cycle Model Chart


The Nasdaq cycle model phase shifted to the right since the last iteration in May, and now suggests a peak in the index at the beginning of September, 2016. A previous iteration of the model is shown below and here on the blog.


2016.05.28 Nasdaq Cycle Model Chart


Sunday, July 3, 2016

2016.07.01 Silver Cycle Model Chart

2016.07.01 Silver Cycle Model Chart


The silver cycle model suggests that the silver price is ahead of the modeled curve prediction.  Usually, a divergence of this magnitude has tended to quickly reverse.  On the other hand, the model is also phase shifting, and it appears that the future silver price may be getting in line with the gold price cycle model. Note that the timing of reversals is relatively preserved, while the magnitude at the point of reversals is less predictable.  A previous iteration of the model is seen below and on the blog.


2016.06.06 Silver Cycle Model Chart

Sunday, June 26, 2016

2016.06.24 Gold Cycle Model Chart

2016.06.24 Gold Cycle Model Chart


The gold cycle model has been performing reasonably well over the past few months. There is strong cyclical pressure for higher prices going into Summer and Fall. A reminder that these models are based on extraction of cycles based on historical data, and contain no information on "current events."  Previous iterations of the model are found below and on the blog.


2016.05.20 Gold Cycle Model Chart

2016.04.01 Gold Cycle Model Chart

Saturday, June 4, 2016

2016.06.04 XOI.X Cycle Model Chart

2016.06.03 XOI.X Cycle Model Chart


The most recent model run suggests the index is ending its pause and the resumption of a rise is imminent.  The previous model run is shown below and here on the blog.


2016.04.15 XOI.X Cycle Model Chart

Saturday, May 28, 2016

2016.05.28 NASDAQ Cycle Model Chart

2016.05.28 NASDAQ Cycle Model Chart


I have worked on and off for the past six months on this new model featuring the NASDAQ index. It has been tested on out-of-sample data and passes with flying colors. Nevertheless, once again a reminder that all models are wrong but some are useful.  The model suggests a change in the long term direction of the index beginning in the mid-June time frame.

Saturday, May 21, 2016

2016.05.20 Gold cycle Model Chart

2016.05.20 Gold Cycle Model Chart


The gold cycle model suggests continued upward prices in gold going into the Summer/Fall. It appears that the previous phase extension has slowed down, so to use Mr Anon's term, perhaps the model may be "in the groove."  Below is the previous model run also shown on the blog here.


2016.04.01 Gold Cycle Model Chart

Sunday, May 15, 2016

2016.05.13 DJIA Cycle Model Chart

2016.05.13 DJIA Cycle Model Chart


The DJIA cycle model is phase shifting to the right, but still continues to converge relatively quickly. If the model is correct, there is a lot of downward pressure on prices from a cyclical perspective.  I would urge readers to look at the previous model run here for additional comment. It is also shown below.


2016.03.24 DJIA Cycle Model Chart

Sunday, May 8, 2016

2016.05.06 Silver Cycle Model Chart

2016.05.06 Silver Cycle Model Chart


The silver cycle model suggests that silver prices may have reached a local maximum, and that there is downward pressure now to below $16. The model has been performing relatively well, as can be seen from a previous model run below and here on the blog.


2016.03.04 Silver Cycle Model Chart

Friday, April 15, 2016

2016.04.15 XOI.X Cycle Model Chart

2016.04.15 XOI.X Cycle Model Chart


There is a slow right phase shift in the XOI model, however, the local minimum of the index price curve continues to scrape around 1000, suggesting that much lower levels for the index are much less probable.  The previous model run is shown below and here on the blog.


2016.03.11 XOI.X Cycle Model Chart

Saturday, April 2, 2016

2016.04.01 Gold Cycle Model Chart

2016.04.01 Gold Cycle Model Chart


Gold prices corrected consistent with the divergence seen in the previous model run shown below and here on the blog. Going forward, the model suggests a strong and increasing upward bias in prices.


2016.02.26 Gold Cycle Model Chart

Saturday, March 26, 2016

2016.03.26 DJIA Cycle Model Chart

2016.03.24 DJIA Cycle Model Chart


The DJIA cycle model is now at an extreme divergence between actual and predicted level for the index. Note that in comparison with a run of the same model on 2015.12.31 shown below and here on the blog, a phase change has occurred, in the opposite direction I expected. The current run of the model suggests an even steeper slope down for the rest of the year, whereas the December run suggested a flat period for index prices between march and September.  Also note that I had to adjust the Z-score scale as the divergence is heading towards -2.5. This is the largest divergence since Spring, 1981; August 1946; Spring 1943; Spring, 1930; October, 1929.  The lowest Z-score for the model was -3.53 in September, 1929.  Remembering that all models are wrong but some are useful, my current interpretation is that there are extremely powerful convergent  downward cycles at play here, from yearly to decadal,  but the caveat is that central bank liquidity and forex management do not enter into the model whatsoever.


2015.12.31 DJIA Cycle Model Chart

Saturday, March 12, 2016

2016.03.12 XOI.X Cycle Model Chart

2016.03.11 XOI Cycle Model Chart


The XOI cycle model suggests that the index may have traversed its low for the year. The multi-month phase change which has pushed the predictive curve to the right may have ended.  The high positive Z-score, as shown below and here on the blog, indicated a high chance of a positive reversal which did occur.


2016.02.12 XOI Cycle Model Chart