Econocasts

Saturday, December 23, 2017

2017.12.22 XOI.X Cycle Model Chart


2017.12.22 XOI.X Cycle Model Chart


The XOI.X cycle model continues to suggest higher levels for the index going forward into the Spring of 2018.  As can be seen from the previous iteration shown below and here on the blog, the level is increasing as predicted, suggesting perhaps a slow down of the annoying right phase shift, though there is still a large discrepancy between the predicted and actual curves.  In any case, lower levels for the index are highly unlikely going forward, if the model is correct.


2017.09.22 XOI.X Cycle Model Chart


Sunday, November 19, 2017

2017.11.17 Gold Cycle Model Chart

2017.11.17 Gold cycle Model Chart


As it turned out, the rightward phase shift in the gold cycle model continued, and while it looks  highly unlikely that the gold price will drop below ~$1300 going into 2018, there is no guarantee that the right phase shift will end soon. 

Sunday, October 22, 2017

2017.10.20 Silver Cycle Model Chart

2017.10.20 Silver Cycle Model Chart


The silver cycle model suggests a December peak for the silver price. The Z-score suggests a high probability of a short term rise in the silver price. Over the past year, a Z-score of ~2 has adequately predicted turning points. A previous iteration of the model is shown on the blog and below.


2017.08.25 Silver Cycle Model Chart

Monday, September 25, 2017

2017.09.25 XOI.X Cycle Model Chart

XOI.X Cycle Model Chart


The XOI.X cycle model may have ceased its right phase shift, and is predicting much higher prices for the index.  In support, the medium term model for USO is also pointing to higher prices.  The previous model run is shown below and here on the blog.


2017.05.12 XOI.X Cycle Model Chart

Thursday, September 7, 2017

2017.09.06 Gold Cycle Model Chart

2017.09.06 Gold Cycle Model Chart


The gold cycle model, much like the silver cycle model, may have stopped its rightward phase shift and is now suggesting higher prices for the metal going forward to the end of the year. The large difference between the model prediction and actual price suggests strong upward pressure on price with a very low probability of a pullback below ~$1200. A previous run of the model is shown below and here on the blog.


2017.07.21 Gold Cycle Model Chart

Saturday, August 26, 2017

2017.08.25 Silver Cycle Model Chart

2017.08.25 Silver Cycle Model Chart


The silver cycle model is performing quite well, as the right phase shift in the predictive curve seems to have ended for now. A previous iteration of the model is shown below and here on the blog.


2017.07.06 Silver Cycle Model Chart

Saturday, July 22, 2017

2017.07.21 Gold Cycle Model Chart

2017.07.21 Gold Cycle Model Chart


The gold cycle model predictive curve continues to shift to the right, suggesting a continued basing process for the actual price going forwards. What is quite remarkable is that the Z-score is now in record territory for positive Z-scores, but still just below the absolute value record of the Z-score which occurred in 1980.01.21 which was resolved in a few days.  In other words, the actual price caught up with the predicted price.  That said, it is also possible this model is useless at this time. My GDXJ model is still in buy mode as of 2017.07.21, and I still have to execute the run for GLD which I will post here at the end of the weekend.  In the shorter term, the neural models are much more accurate.  One enhancing factor is that they also have inputs for volume related transformations.  The previous model run is shown below and here on the blog.


2017.05.26 Gold Cycle Model Chart

Saturday, July 8, 2017

2017.07.06 Silver Cycle Model Chart

2017.07.06 Silver Cycle Model Chart


The silver cycle model continues to perform reasonably well, and continues to suggest we are approaching or perhaps at a cycle low. A previous iteration of the model appears below and here on the blog.


2017.05.26 Silver Cycle Model Chart

Tuesday, May 30, 2017

2017.05.26 Silver Cycle Model Chart

2017.05.26 Silver Cycle Model Chart


The silver cycle model is performing well, as can be seen from the previous iteration below and on the blog. A Spring peak in price was anticipated.  If the model is correct, we should see a temporary low in the August/September time frame.  As expected, the turning points are better predicted than the magnitude at the turning points, something to keep in mind when interpreting these cyclical models.


2017.03.31 Silver Cycle Model Chart

Saturday, May 27, 2017

2017.05.26 Gold Cycle Model Chart

2017.05.26 Gold Cycle Model Chart


The predictive model continues its shift to the right.  However, the large divergence in the predictive curve to the upside, as metered by the high Z-score, strongly suggests that prices should not fall significantly going forwards. Previous iterations of this cycle model can be found n the blog below.

Sunday, May 14, 2017

2017.05.12 XOI.X Cycle Model Chart

2017.05.12 XOI.X Cycle Model Chart


The model may still be useful, even as the predictive curve continues to shift to the right but suggesting that much  lower prices are not likely in the medium term.The USO medium term model continues to point down, which points to a longer basing process before the any significant rise in price.

Saturday, April 1, 2017

2017.03.31 Silver Cycle Model Chart

2017.03.31 Silver Cycle Model Chart


The lack of any phase shift suggests that the peak in May/June has a high probability.  Note that the magnitude of the peak has changed, but the timing is relatively consistent from the past iteration. The previous iteration of the model is shown below and here on the blog.

2017.02.10 Silver Cycle Model Chart

Sunday, March 5, 2017

2017.03.03 Gold Cycle Model Chart

2017.03.03 Gold Cycle Model Chart


The gold cycle model continues to predict higher prices for the metal, however, there is still some right phase shift of the predictive curve, which has also projected a decrease in the magnitude of the price going forwards. Meanwhile, the GDXJ medium term model has shifted into sell mode on 2017.02.27, however, the medium term model for GLD is still on buy. This is consistent with a long base formation we see in the gold price over the past year. A previous iteration of the model is shown below and here on the blog.


2017.02.03 Gold Cycle Model Chart

Sunday, February 26, 2017

2017.02.24 XOI.X Cycle Model Chart

2017.02.24 XOI.X Cycle Model Chart


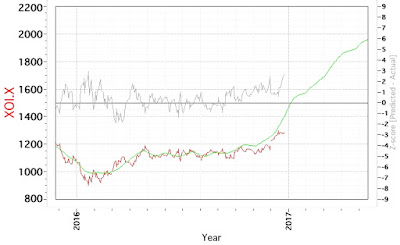
The XOI.X model predictive curve continues to shift to the right, and suggests that much lower prices are highly unlikely, while pressure is building for a rise going forwards.  Astute readers with good memories will realize this is the same analysis as provided from the model run about a month ago shown below. Also of note is that a medium term model of USO continues to remain in sell mode, as shown here.  A previous iteration of the model is shown below and here on the blog.


2017.02.01 XOI.X Cycle Model Chart
 

Saturday, February 11, 2017

2017.02.10 Silver Cycle Model Chart

2017.02.10 Silver Cycle Model Chart


The silver cycle model is performing well, and previously suggested a rise in price based on the inflection point at the beginning of 2017.  While there may be some continued right phase shift in the predictive curve, the model is calling for another inflection point in late Spring of 2017 which based on past performance could extend into Summer or early Fall.  A previous iteration of the model is shown below and here on the blog.


2016.12.30 Silver Cycle Model Chart

Sunday, February 5, 2017

2017.02.03 Gold Cycle Model Chart

2017.02.03 Gold Cycle Model Chart


The gold cycle model continues to predict higher prices for the metal going forwards.  The end of 2016 may have seen an inflection point if the model is valid.  Both the GDXJ and GLD medium-term trade models are aligned, as they have been in buy mode since the end of 2016, which lends additional support to the hypothesis. You can go to the medium term model out page on the link above or by clicking here. The medium-term models are updated on Fridays, and I will post any changes that occur on the weekend.  The previous gold cycle model is shown below and here on the blog.


2017.01.06 Gold Cycle Model Chart

Thursday, February 2, 2017

2017.02.01 XOI.X Cycle Model Chart

2017.02.01 XOI.X Cycle Model Chart


The XOI.X model predictive curve continues to shift to the right, and suggests that much lower prices are highly unlikely, while pressure is building for a rise going forwards.  That said, my medium-term trading model for USO went short on December 21, 2016 and continues short.  I update it on Fridays, so if it changes, I will post a comment here.  A previous iteration of the model is shown below.


2016.12.27 XOI.X Cycle Model Chart

Sunday, January 8, 2017

2017.01.06 Gold Cycle Model Chart

2017.01.06 Gold Cycle Model Chart


The gold cycle model suggests rising prices for the metal into 2017. The model may continue to shift the predictive curve to the right.  Even if it does, the sharp slope of the predictive curve suggests that the price should not drop significantly going forwards.  I have seen predictions for a much lower price for the metal, some well below $1000 which according to the model would be very unlikely.  Whether the model remains somewhat useful going forwards will be determined in the next few months.  My pattern recognition neural GDXJ medium term trading model went positive at the end of the 2016, so that it is aligned with the cycle model, at least for now.Below I show the previous iteration of the model, also here on the blog.


2016.12.02 Gold Cycle Model Chart

Sunday, January 1, 2017

2016.12.30 Silver Cycle Model Chart

2016.12.30 Silver Cycle Model Chart


The silver cycle model shows both a phase shift to the right as well a change in magnitude.  If the model is valid, we should continue to see a continued rise in price, along with the usual volatility, if the price resolves as it did in June, 2016. A previous iteration of the model is shown below and here on the blog.


2016.12.02 Silver Cycle Model Chart