 |
| 2014.12.26 XOI.X Cycle Model Chart |
The oil index model suggests that prices will stabilize in the 1300 area in the first quarter of 2015. A previous iteration of the model is shown below and here.
 |
| 2014.03.31 XOI.X Cycle Model Chart |
|
| 2014.12.26 XOI.X Cycle Model Chart |
|
| 2014.03.31 XOI.X Cycle Model Chart |
 |
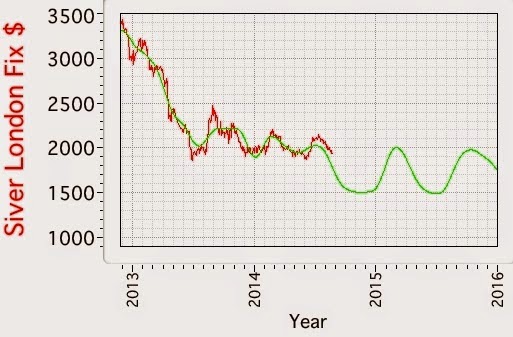
| 2014.12.12 Silver Cycle Model Chart |
 |
| 2014.10.31 Silver Cycle Model Chart |
 |
| 2014.10.06 Silver Cycle Model Chart |
 |
| 2014.09.19 Silver Cycle Model Chart |
 |
| 2014.12.12 Gold Cycle Model Chart |
 |
| 2014.10.31 Gold Cycle Model Chart |
 | ||||
| 2014.11.26 XOI.X Cycle Model Chart |
 |
| 2014.02.07 XOI.X Cycle Model Chart |
 |
| 2014.10.31 Silver Cycle Model Chart |
 |
| 2014.09.19 Silver Cycle Model Chart |
 |
| 2014.10.31 Gold Cycle Model Chart |
 |
| 2014.10.03 Gold Cycle Model Chart |
 |
| 2014.10.17 XOI.X Cycle Model Chart |
 |
| 2014.02.07 XOI.X Cycle Model Chart |
 |
| 2014.10.06 Silver Cycle Model Chart |
 |
| 2014.08.22 Silver Cycle Model Chart |
 |
| 2014.10.03 Gold Cycle Model and Z-score |
 |
| 2014.09.05 Gold Cycle Model and Z-score |
 |
| XOI.X 2014.09.26 Cycle Model Chart |
 |
| XOI.X 2014.02.07 Cycle Model Chart |
 |
| 2014.09.19 Silver Cycle Model Chart |
 |
| 2014.01.17 Silver Cycle Model Chart |
 |
| 2014.09.05 Gold Cycle Model Chart and Z-score |
 |
| 2014.04.25 Gold Cycle Model Chart |
 |
| 2014.08.22 Silver Cycle Model Chart |
 |
| 2014.03.28 Silver Cycle Model Chart |
 |
| 2014.08.15 XOI.X Cycle Model Chart |
 |
| 2013.12.06 XOI.X Cycle Model Chart |
 |
| 2014.07.25 Gold Cycle Model |
 |
| 2014.04.25 Gold Cycle Model |
 |
| 2014.07.11 XOI.X Cycle Model Chart |
 |
| 2014.02.07 XOI.X Cycle Model |
 |
| 2014.06.27 Gold Cycle Model Chart |
 |
| 2014.05.30 Gold Cycle Model Chart |
 |
| 2014.06.13 XOI.X Cycle Model Chart |
 | |||
| 2014.02.07 XOI.X Cycle Model Chart |
 |
| Gold Cycle Model 2014.05.30 |
 |
| Gold Cycle Model 2014.03.20 |
 |
| 2014.05.16 XOI.X Cycle Model |
 |
| 2014.02.28 XOI.X Cycle Model |
 |
| 2014.05.02 Silver Cycle Model |
 |
| 2014.02.14 Silver Cycle Model |
 |
| 2014.04.25 Gold Cycle Model |
 |
| 2014.03.20 Gold Cycle Model |
 |
| 2014.03.31 XOI.X Cycle Model |
 |
| 2014.02.28 XOI.X Cycle Model |
 |
| 2014.03.28 Silver Cycle Model Chart |
 |
| 2014.02.14 Silver Cycle Model Chart |