Econocasts

Sunday, December 16, 2018

2018.12.14 Silver Cycle Model Chart

2018.12.14 Silver cycle Model Chart


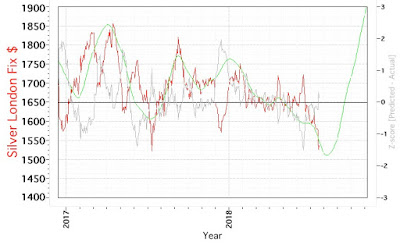
The silver cycle model is suggesting a rise in price with a local maximum in the first quarter of 2019.  The previous run of the model is shown below and here on the blog.


2018.07.20 Silver Cycle Model Chart

Saturday, December 8, 2018

2018.12.07 Gold Cycle Model Chart

2018.12.07 Gold Cycle Model Chart


The gold cycle model continues its right phase shift, but happily the model continues to converge. Much like 6 months ago, the model suggests the chance of a large price drop is small and the basing process continues unabated.  The previous run is shown below and here on the blog.  Note the change in the time and price axes.


2018.06.22 Gold cycle Model Chart

Sunday, November 25, 2018

2018.11.25 XOI.X Cycle Model Chart

2018.11.25 XOI.X Cycle Model Chart


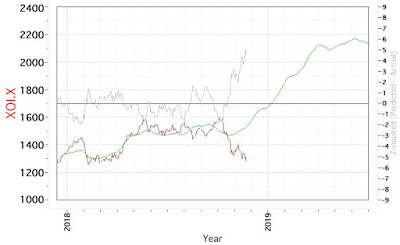
The model continues to converge, but there is a continuing right phase shift and a wide discrepancy between actual and predicted suggesting lower prices are much less probable. Note also the change in the right axis descriptors, as the maximum has decreased from 2800 to just under 2200.  A previous iteration of the model is shown below and here on the blog. 

A surrogate oil index, USO, remains on sell according to the medium term models, and has been on sell since 2018.10.04.  This suggests the right phase shift of the cycle model may continue for a while. 


2018.09.07 XOI.X Cycle Model Chart

Wednesday, November 21, 2018

2018.11.21 NASDAQ Cycle Model Chart

2018.11.21 NASDAQ Cycle Model Chart


The NASDAQ cycle model seems to be suggesting that a temporary low in the index has arrived. However, this needs to be taken in the context that my cycle models attached to equity indices have not performed well in the past few years, so this may be a random "hit." The previous run of the model is shown below and here on the blog.


2018.09.12 NASDAQ Cycle Model Chart

Sunday, September 16, 2018

2018.09.14 NASDAQ Cycle Model Chart

NASDAQ Cycle Model Chart


As I mentioned in the past, I think the effect of the Federal Reserve Bank monetary expansion on the business cycle has rendered predictions based on cycle theory to be somewhat problematic, and that may not be a strong enough statement.  For commodity indices, the effect may be somewhat muted since they are based on lag times between resource extraction capex and output, and of course the mismatch that eventually occurs between supply and demand.  Those mismatches betwen supply and demand result in a stronger cyclical signal that can be picked up by the analyses. Nevertheless, the market cycle models may still provide some information which links economic activity with price, but I would be wary of using any of the cyclical market models for short or medium term investment purposes. I learned how to use pattern recognition algorithms to get a better handle on short and medium term movements.  I put examples of those efforts here on the blog, but I do not have the time or inclination to present real time updates.

Sunday, September 9, 2018

2018.09.07 XOI.X Cycle Model Chart

2018.09.07 XOI.X Cycle Model Chart


The model stubbornly suggests higher prices for the index going forward into the Fall and Winter. The level of divergence between actual and predicted values for the index exceed those observed on 2008.10.10, which were resolved in the next few weeks according to the prediction.  That said, there is also the possibility that the model is failing.  Remember that all models are wrong, but some are useful.  Previous runs of this model are shown below and here.


2018.07.12 XOI.X Cycle Model Chart


The medium term model output shown here also suggests higher prices for USO.

Sunday, July 22, 2018

2018.07.20 Silver Cycle Model Chart

2018.07.20 Silver Cycle Model Chart


The silver cycle model is, for the moment, in non-technical language, "in the groove." The model continues to suggest a local minimum in August, followed by a rise in the price into the Fall.  Two previous iterations of the model are shown below, and here and here on the blog.


2018.05.18 Silver Cycle Model Chart


2018.04.20 Silver Cycle Model Chart

Friday, July 13, 2018

2018.07.12 XOI.X Cycle Model Chart

2018.07.12 XOI.X Cycle Model Chart


The XOI.X cycle model suggests higher values for the index moving into late Summer and Fall of 2018. The probability of a right phase shift is decreased because of the slope at the inflection point.  The previous model run is shown below and here on the blog.


2018.05.05 XOI.X Cycle Model Chart

Sunday, June 24, 2018

2018.06.25 Gold Cycle Model Chart

2018.06.22 Gold Cycle Model Chart


The right phase shift continues, and I suspect that it may continue for several months.  This is due to model error in both cycle length and phase for several decadal cycles at play during this time.  The model does suggest that much lower prices for the gold fix are highly unlikely going forwards, but that the longer term basing at ~$1300 +/- 20% can be extended.  Extrapolating the model error as noted by the Z-score, I will hazard a guess that the right phase shift will end in the October and November 2018 time frame and either the model dies, or the price does begin to more closely match model prediction.

Saturday, May 19, 2018

2018.05.18 Silver Cycle Model Chart

2018.05.18 Silver Cycle Model Chart


The silver cycle model continues to suggest lower prices with a nadir in August, 2018. A previous iteration of the model is shown below and here on the blog.


2018.04.20 Silver Cycle Model Chart

Sunday, May 6, 2018

2018.05.04 XOI.X Cycle Model Chart

2018.05.04 XOI.X Cycle Model Chart


This cycle model continues to phase shift to the right, but suggests that higher levels for the index are much more probable going into the Summer and Fall seasons.  The medium term model has shown USO to be in buy mode since 2018.04.10 as shown here. The previous output of the model is shown below and here on the blog.


2018.01.19 XOI.X Cycle Model Chart

Saturday, April 21, 2018

2018.04.20 Silver Cycle Model Chart

2018.04.20 Silver Cycle Model Chart


The model continues to suggest that the local maximum was reached in late January, 2018, and lower prices are highly probable between now and August, 2018.


Sunday, February 18, 2018

2018.02.16 Gold Cycle Model Chart

2018.02.16 Gold Cycle Model Chart


The right phase shift continues, but gold prices remained above $1300 as suggested by the previous model run.  Notice though that the magnitude has shifted lower compared to the previous model iteration.  I also just updated the medium term model output page, and GDXJ is again in buy mode.


Saturday, January 20, 2018

2018.01.19 XOI.X Cycle Model Chart

2018.01.19 XOI.X Cycle Model Chart


The cycle model for XOI.X suggests that the basing process over the past year may be ending, and there is strong pressure for an increase in the index values moving into Spring of 2018. One of the stronger cycles that appears in this model is ~11.6 years, which coincides with the solar cycle length, and sky watchers are aware that we are entering a solar minimum.  Of course, correlation does not prove causation, and the model can be wrong.  However, I find it pretty interesting!  My USO medium Term AI model also continues to suggest higher prices as well. The previous output of the cycle model is shown below and here on the blog.


2017.12.22 XOI.X Cycle Model Chart


Saturday, January 13, 2018

2017.01.11 Silver Cycle Model Chart

2018.01.11 Silver Cycle Model Chart


This is the same model, and I thought it might not converge since it took more iterations than average, but it clearly shows, if it is correct, that the price has reached a local maximum at the beginning of this year. Going forward, we should expect to see lower silver prices.  As can happen with these kinds of models, the local maximum may have been predicted relatively well in time, however the magnitude was much lower than expected.

For anyone who has purchased a silver model since 2017.01.01, please contact me via the secure portal on the site, and I will be happy to send you a new version of the long term predictions at no cost.

The previous iteration can be found here and below.


2017.10.20 Silver Cycle Model Chart