 | ||
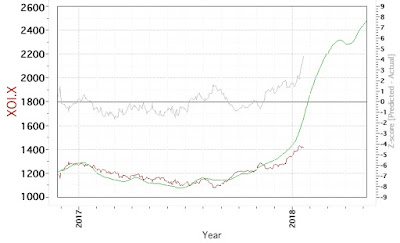
| 2018.05.04 XOI.X Cycle Model Chart |
This cycle model continues to phase shift to the right, but suggests that higher levels for the index are much more probable going into the Summer and Fall seasons. The medium term model has shown USO to be in buy mode since 2018.04.10 as shown here. The previous output of the model is shown below and here on the blog.
 |
| 2018.01.19 XOI.X Cycle Model Chart |
No comments:
Post a Comment