 |
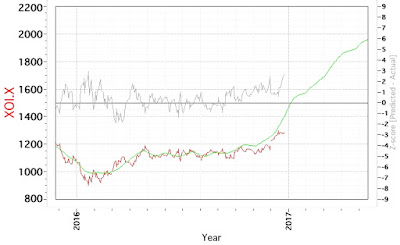
| 2017.02.01 XOI.X Cycle Model Chart |
The XOI.X model predictive curve continues to shift to the right, and suggests that much lower prices are highly unlikely, while pressure is building for a rise going forwards. That said, my medium-term trading model for USO went short on December 21, 2016 and continues short. I update it on Fridays, so if it changes, I will post a comment here. A previous iteration of the model is shown below.
 |
| 2016.12.27 XOI.X Cycle Model Chart |
No comments:
Post a Comment