Econocasts

Saturday, May 28, 2016

2016.05.28 NASDAQ Cycle Model Chart

2016.05.28 NASDAQ Cycle Model Chart


I have worked on and off for the past six months on this new model featuring the NASDAQ index. It has been tested on out-of-sample data and passes with flying colors. Nevertheless, once again a reminder that all models are wrong but some are useful.  The model suggests a change in the long term direction of the index beginning in the mid-June time frame.
Saturday, May 21, 2016

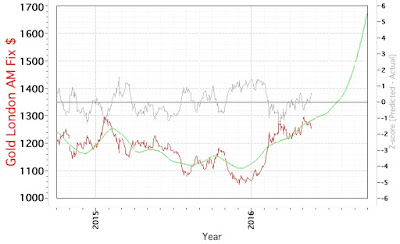
2016.05.20 Gold cycle Model Chart

2016.05.20 Gold Cycle Model Chart


The gold cycle model suggests continued upward prices in gold going into the Summer/Fall. It appears that the previous phase extension has slowed down, so to use Mr Anon's term, perhaps the model may be "in the groove."  Below is the previous model run also shown on the blog here.


2016.04.01 Gold Cycle Model Chart

Sunday, May 15, 2016

2016.05.13 DJIA Cycle Model Chart

2016.05.13 DJIA Cycle Model Chart


The DJIA cycle model is phase shifting to the right, but still continues to converge relatively quickly. If the model is correct, there is a lot of downward pressure on prices from a cyclical perspective.  I would urge readers to look at the previous model run here for additional comment. It is also shown below.


2016.03.24 DJIA Cycle Model Chart

Sunday, May 8, 2016

2016.05.06 Silver Cycle Model Chart

2016.05.06 Silver Cycle Model Chart


The silver cycle model suggests that silver prices may have reached a local maximum, and that there is downward pressure now to below $16. The model has been performing relatively well, as can be seen from a previous model run below and here on the blog.


2016.03.04 Silver Cycle Model Chart