 |
| 2016.05.28 NASDAQ Cycle Model Chart |
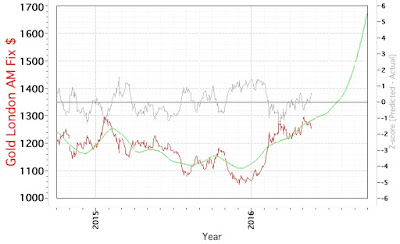
I have worked on and off for the past six months on this new model featuring the NASDAQ index. It has been tested on out-of-sample data and passes with flying colors. Nevertheless, once again a reminder that all models are wrong but some are useful. The model suggests a change in the long term direction of the index beginning in the mid-June time frame.


