Econocasts

Wednesday, December 28, 2011

2011.12.28 Interim Short Term DJIA $ Gold $ Silver


Index / Actual / Predicted / Z

DJIA / 12151.41 / 11279.06 / -1.47
Gold / 1584.00 / 1503.54 / -2.24
Silver / 2865 / 2813 / -0.50

I guess I might as well enjoy when the PM curves are closely convergent - since it probably will not last too long!

Visit econocasts.net for free sample trading model downloads. 

Friday, December 23, 2011

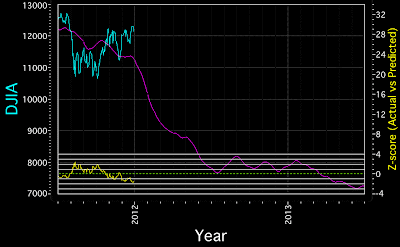
2011.12.23 Weekly Short Term DJIA $ Gold $ Silver


Index / Actual / Predicted / Z-score

DJIA / 12294.00 / 11314.90 / -1.63
Gold / 1607.50 / 1512.43 / -2.62
Silver / 2922 / 2882 / -0.37

I have advanced the charts to start mid-2011 and end mid-2013. The prediction curves or "attractors" have a steep negative slope going forward.  If the models are correct, I would expect continued downward pressure on both precious metal and equity prices.

Visit econocasts.net for free sample trading model downloads. 

Sunday, December 18, 2011

2011.12.18 Experimental Amex Oil Index (XOI)


Actual / Predicted / Z-score
1170.19 / 1174.97 / 0.17


I have not kicked the tires on this model so it still rates as experimental. Originally I produced it as a favor to Zero_Sum from daneric's site. Here it is again, warts and all.

Previous iterations below:.

2011.10.12 - AMEX Oil Index (XOI.X)
2011.09.25 - AMEX Oil Index (XOI.X)
2011.09.14 - AMEX Oil Index (XOI.X)
2011.08.24 - AMEX Oil Index (XOI.X)


Visit econocasts.net for free sample trading model downloads. 

Friday, December 9, 2011

2011.12.09 Weekly Short Term DJIA $ Gold $ Silver


Index / Actual / Predicted / Z-score

DJIA / 12184.26 / 11192.44 / -1.67
Gold / 1712 / 1585 / -3.32
Silver / 3200 / 2966 / -2.05

Visit econocasts.net for free sample trading model downloads. 

Friday, December 2, 2011

2011.12.02 Weekly Short Term DJIA $ Gold $ Silver


Index / Actual / Predicted / Z-score
DJIA / 12019.42 / 11118.52 / -1.54
Gold / 1751.00 / 1544.00 / -5.36
Silver / 3315.00 / 2900.43 / -3.60


Visit econocasts.net for free sample trading model downloads.

Wednesday, November 30, 2011

2011.11.30 Interim Long Term DJIA $ Gold $ Silver


DJIA / 12045.68 / 11079.58 / -1.65
Gold / 1717.00 / 1551.58 / -4.33
Silver /  3135.00 / 2855.05 / -2.53

My bias, given the low volume rally, is that the end of the month spike in the DJIA and PM's was an aberration and prices should adjust down in the very near future. For the DJIA, the predicted price is again at historical levels below the actual price, which has not lasted  longer than 5-10 trading days in the past. The same can be said for the PM's. The usual short term predictions will be available late Friday.


Visit econocasts.net for free sample trading model downloads.


Friday, November 18, 2011

2011.11.18 Weekly Short Term DJIA $ Gold $ Silver


I expect downward pressure on prices to continue. All three models converged immediately.

Index/Actual/Predicted/Z-score

DJIA/11798/11154/-1.10
Gold/1730/1586/-3.72
Silver/3225/2873/-2.96

Have a great weekend!

Visit econocasts.net for free sample trading model downloads. 


Friday, November 11, 2011

2011.11.11 Weekly Short Term DJIA $ Gold $ Silver


The quick convergence of all three models suggests that if they are wrong, they are wrong in the right way. On the other hand, if they are still predictive, they are all stretching to historical maxima. This suggests if there is a reversal, it will be quite steep.

Index / Actual / Predicted / Z-score
DJIA / 12153.68 / 11252.09 / -1.52
Gold / 1764.00 / 1582.93 / -4.67
Silver / 3377 / 2906 / -3.85

-----------------------------------------
To save time, I will only post the long term predictions on a monthly basis, since week to week differences are trivial. If there is a major phase change in the model, as occurred with silver a while back, I will post it and note it. Have a great weekend!

Visit econocasts.net for free sample trading model downloads. 

Wednesday, November 9, 2011

2011.11.08 Interim Short Term DJIA $ Gold $ Silver


All prices are close to historical extremes even after today.  If the past has any say, the actual price curves should now drop below the predictor curves.

Visit econocasts.net for free sample trading model downloads. 

Friday, November 4, 2011

2011.11.04 Weekly DJIA Long $ Short Term


Today, the model converged within a couple of minutes, and with a better fit after chugging all night to converge yesterday.  I am still expecting a major correction with a steep downward slope, maybe in the next week or two,  if the model is working out.

Since these cycle models try to adapt to new data, the predicted turning points may change with time, so it is helpful to look back at earlier models to get an idea of model behavior.

Visit econocasts.net for free sample trading model downloads. 

Wednesday, November 2, 2011

2011.11.02 Interim DJIA Long $ Short Term


You can see that there is a smaller ~ 3 to ~4 month cycle here superimposed on the larger set of cycles headed down. The large improvement in overall fit results because it appears to operate back to 1896 with some variations on the theme.

Visit econocasts.net for free sample trading model downloads. 

Sunday, October 30, 2011

2011 10.30 Weekly DJIA Long $ Short Term


After updating, the model discovered a short period cycle resulting in a much better overall fit. Had the model not converged, it would have been thrown out.  There is still a high discrepancy between the actual and predicted price, though not quite large as before.

Visit econocasts.net for free sample trading model downloads. 

Friday, October 28, 2011

2011.10.28 Interim Gold Long $ Short Term


From this model's perspective, this is an almost six-sigma event.

This is so weird that I'm going to hold off judging whether the model is valid.  A week or two and the answer should be obvious. Maybe.

Visit econocasts.net for free sample trading model downloads. 

Wednesday, October 26, 2011

2011.10.26 Interim Gold $ Silver Short Term


Both of these models have reached extreme values of disparity between the actual price and the predicted price. Based on information from a completely different model for SLV I use to guide investment stance,  my bet would be that silver will be the one that breaks down first but GLD is still in "buy mode" as of this moment.The concordance of the two models from the two time series supports validity, or the same structural flaw is present in the two models. This is unlikely but....

So, the possibilities remain:

  • the model is valid (look out below! soon!)
  • we are experiencing a "six-sigma" event but the model is valid (look out below, at some point)
  • the model is not valid 
Visit econocasts.net for free sample trading model downloads. 

Saturday, October 15, 2011

2011.10.15 DJIA 1928-1932 and 2004-2012


click on images to enlarge


Rather than another tedious 1929 to the present comparison, here is a less tedious one. I wanted to highlight a couple of points. The first is that the spread between the actual price and predicted price, as measured by the yellow Z-score has now broken the record for historical extremes on the upside.

The second point is made by the red circles on the charts, showing where flat patterns developed during relief rallies just after 1929.  The technical term for this is "frog jumping down steep hill" also known as "the toad tilt."

These time series are multifractal, as discovered by Benoit Mandelbrot and others.  This means that scaling may occur simultaneously along the time and the price axis. In other words, one pattern may match another by stretching or compressing both time and price scales.

If this model is correct, we should soon be traveling down a steep slope, probably by next week. If prices increase much more, or even stay relatively static for a few trading days, and the Z-score goes to >5, then I'll have to retire this structural equation cycle model.  Either way, there is a lot to be learned depending on what happens next week.

I'll be answering some thoughtful posts over the weekend, good luck and good health to all!

Visit econocasts.net for free sample trading model downloads. 

Friday, October 14, 2011

2011.10.14 DJIA: Long $ Short Term Predictions


click on images to enlarge


In honor of this historic occasion, I have represented the very long term DJIA chart above.

If I was long this market, I would be very very afraid.  According to this model, this level of divergence was last seen in 1929 where the actual price is so much higher than the predicted price. There are other instances of higher divergences, but they have always occurred on the downside, not on the upside.  Of course, "this time it may be different."

I would rate the chance of a significant correction next week to be extremely high. Of course, it is also possible that this particular cycle model may be ready for /dev/null or the bitbucket, or the dustbin.  I don't think so - but I'm biased.

Visit econocasts.net for free sample trading model downloads. 

2011.10.14 Gold: Long $ Short Term Predictions


click on images to enlarge


This is the fourth time this year that the divergence between the actual price and predicted price has reached z>2. All of those times were associated with reversals. The probability of a reversal is very high in the next 5 days +/-.

Visit econocasts.net for free sample trading model downloads. 

Thursday, October 13, 2011

2011.10.13 Silver: Long $ Short Term Predictions


The last few times that the spread between the the actual price curve and the model prediction curve reached 2 SD units, a correction occurred in less than five trading days.

Links to previous silver cycle model charts

2011.10.07
2011.09.30
2011.09.23
2011.07.15
2011.06.26

Visit econocasts.net for free sample trading model downloads. 

Wednesday, October 12, 2011

2011.10.12 DJIA Z-score of cycle model differences


Click on the image to enlarge.  To keep the chart simple on the cycle models, I use the absolute value of the z-score, since it is a symmetrical function. In this case, the sign value (+ or -) shows the direction of the expected reversal. Thanks to Greenface over at daneric's site for asking the question that inspired this.

Viewed in a historical context, this EOD chart suggests we are approaching historical extremes not seen since the mid-50's as well as other economically unpleasant periods in the past.

Edit on 2011.110.12 at 16:30:  I prettied up the chart and used EOD DJIA data rather than the 2:00 PM market price level.  The story is the same.

Visit econocasts.net for free sample trading model downloads. 

Tuesday, October 11, 2011

Cycle Models: DJIA Long $ Short Term Predictions


Today, the DJIA actual price curve has moved almost 2 standard deviation units from the model curve, so here it is for the record.  This is an extreme value suggesting that a correction, which would bring the two curves together, is probably not far off.  Or this model is broken.  I'd vote for the former, but I'm biased.

Thursday, October 6, 2011

Cycle Models Silver Long $ Short Term Predictions


No, this Silver model is not a mistake.  It is the latest structural equation model.  I have been doing silver model updates mid-week because I was expecting the possibility of a model bifurcation given the differences in long-term predictions between two usually correlated metals comparing the older silver model with the present gold model. I was rewarded early this morning having watched the "parameter screen" with utter amazement, feeling like I was watching a screen in the Matrix. The new model slowly collapsed two longer fractal cycles into one cycle.  This is always a Good Thing because the fewer parameters, the better the model.

If you look closely, on the short term side, there is no significant difference between the old and new silver model in the short-term.  Both predict a downdraft.   The new model shows a much different longer term prediction, which is more in line with the gold model, and in line with a deflationary depression. It was hard trying to see how gold could go one way and silver another for a prolonged period of time.  It turns out that in statistics speak, there is not much difference between the old and new silver model - we are simply looking at two possible outcomes of almost even probability.

Taken together, my observations on the two models point to the new silver model as having better predictive accuracy, but not because of model statistics - this is my opinion. I will continue to run both old and new silver models to see if the next few days the new model declares itself as statistically better.  Or not.  Meanwhile, I am posting the new silver cycle model as the default model.