Econocasts

Saturday, March 23, 2013

2013.03.22 Cycle Charts


Comparing this to the last cycle chart for the DJIA, there are several high-amplitude historical cycles that continue to attract prices lower.  As I mentioned previously, the take home message is that the Fed, by buying financial assets from banks at the rate of $85 billion per month, may have been successful in extending the cycle amplitudes, but is pushing against history.

Like everyone else, I am trying to make sense of what appears to be a major misstep by the ECB/IMF with respect to the Cyprus dilemma. Since confidence is the spittle holding the banking system together given the drought of liquidity, anything that inspires people to move their assets out of banks is exactly the wrong way to restore trust in the banking system. The ECB may have made bank runs a major topic of discussion not just in Cyprus, but in any EU country with a lame banking system. Perhaps as Martin Armstrong likes to say: It's just time.

Wednesday, January 2, 2013

2012.12.31 Cycle Charts


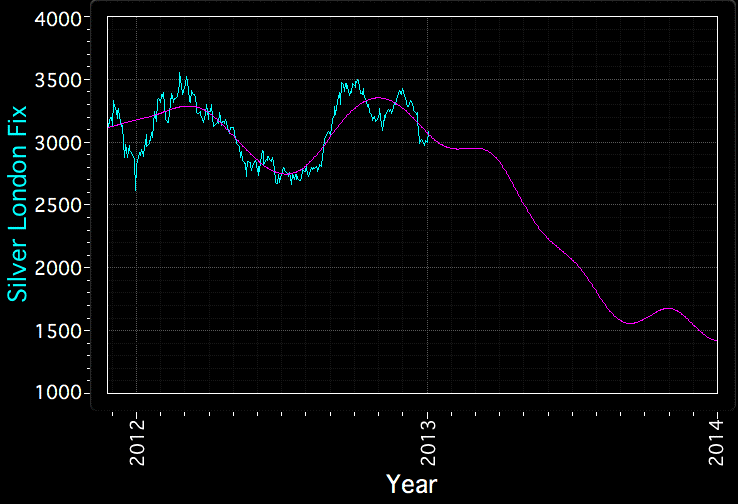
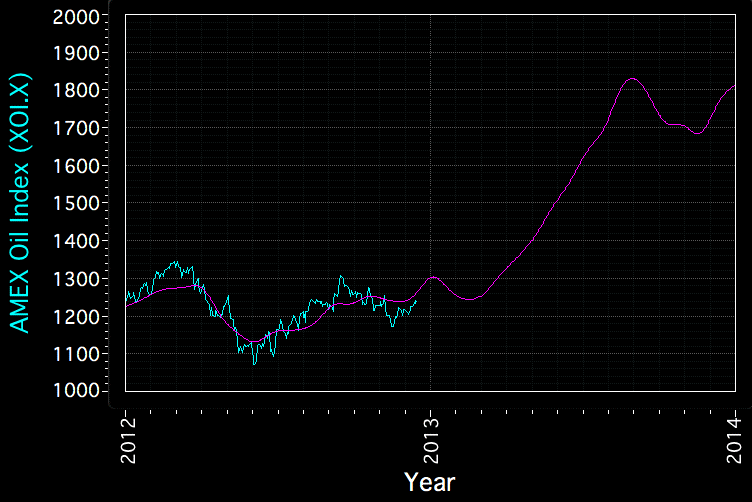
Here are the cycle charts for the end of the year 2012.  I will post quarterly updates since more frequent updates are not required given the models' turning point errors which are somewhere in the 6-12 month  given that higher frequency cycles with a period < 233 days have been eliminated.  I cannot explain why the Amex Oil Index model is predicted to rise well into 2014 while the DJIA, gold and silver all look like they are responding to deflationary pressures all through the year.

The American economy continues to consume more than it produces as outlined by the ever-increasing current account deficit. This reflects deep underlying structural issues that will not be palliated by the so-called "fiscal cliff compromise."  I continue to believe that while the Fed has stretched the 81 +/- year cycle that defines the baseline through the current topping process as reflected in the equity markets, it has not abolished that cycle. If I am to believe the cycle models, then 2013 should be the year where the markets realize their predicament and act accordingly.

I'll take this opportunity to wish everyone a happy, healthy and successful year!


Sunday, December 16, 2012

2012.12.14 Monthly Amex Oil Index Cycle Chart


Here is the Amex Oil Index model. This model is the only one that remains unchanged from July, 2012.  It did not have any interest rate or unemployment data inputs and there may be a lesson in this. KISS.