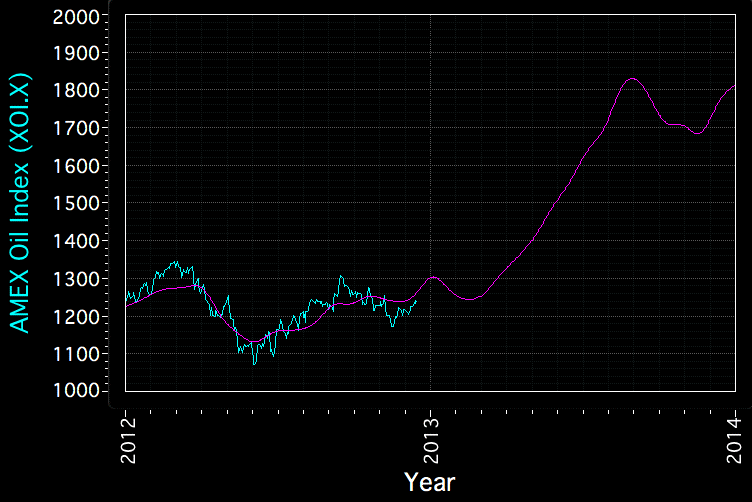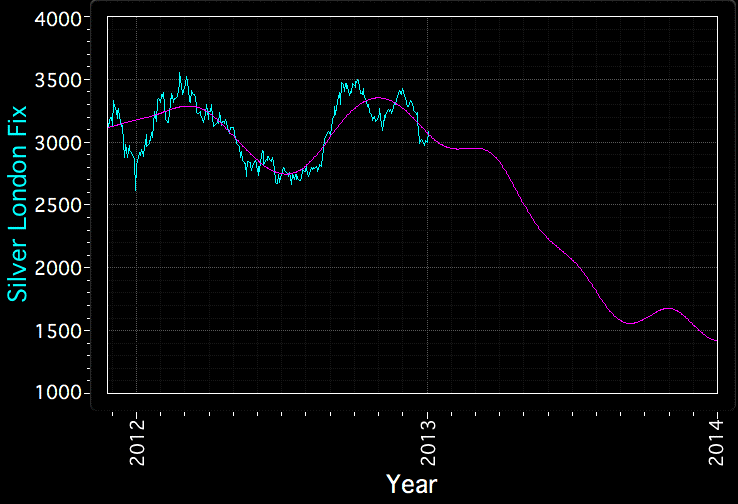


Here are the cycle charts for the end of the year 2012. I will post quarterly updates since more frequent updates are not required given the models' turning point errors which are somewhere in the 6-12 month given that higher frequency cycles with a period < 233 days have been eliminated. I cannot explain why the Amex Oil Index model is predicted to rise well into 2014 while the DJIA, gold and silver all look like they are responding to deflationary pressures all through the year.
The American economy continues to consume more than it produces as outlined by the ever-increasing current account deficit. This reflects deep underlying structural issues that will not be palliated by the so-called "fiscal cliff compromise." I continue to believe that while the Fed has stretched the 81 +/- year cycle that defines the baseline through the current topping process as reflected in the equity markets, it has not abolished that cycle. If I am to believe the cycle models, then 2013 should be the year where the markets realize their predicament and act accordingly.
I'll take this opportunity to wish everyone a happy, healthy and successful year!