 |
| 2015.09.04 Gold Cycle Model Chart |
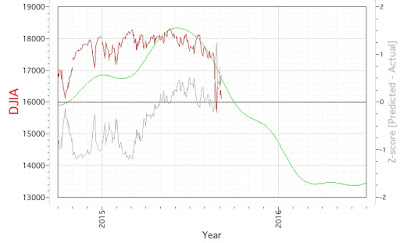
The gold cycle model shows that over the past month, a long-term cycle extension has pushed the predictive model curve forward, but not enough to break the model, at least as of now. Please note I have changed the scale of the price. The high Z-score from the previous iteration, as shown below, was associated with a rise in price level, though not enough to go return back into 'neutral zone' around the +/- 1 Z-score. The previous iteration is shown below and
here on the blog.
On a macro level, I was pondering how gold might rise in an environment where the received wisdom of the markets is that there will be a rate increase which will push up the dollar, thereby putting downward pressure on prices. However, one data point I noted was that during the recent equity market declines, capital did not appear to flow into 'safe' treasuries at the historically expected rate, which was explained by Asia selling USTs to support their currency, as they experience capital flows out of the respective countries. For hedgers trying to front-run the Fed, this was a disaster. Even if the Fed does raise rates, I wonder if that might have the opposite of the intended effect, since that would put even more pressure on countries holding a high level of US debt, and the response may be to sell the debt to support the currencies. I'm not an economist so take the musings with a grain of salt or two!
 |
| 2015.07.17 Gold Cycle Model Chart |


