The gold cycle model continues to show a low in the February/March 2014 time frame, as you can see comparing the current output to the previous cycle model chart from 2013.10.11 as shown below. However, the slight shift in cycle weights has moved the presumed low from the 1300 area to the 1150 area.
Saturday, November 30, 2013
2013.11.29 Gold Cycle Chart
The gold cycle model continues to show a low in the February/March 2014 time frame, as you can see comparing the current output to the previous cycle model chart from 2013.10.11 as shown below. However, the slight shift in cycle weights has moved the presumed low from the 1300 area to the 1150 area.
Thursday, November 28, 2013
2013.11.27 DJIA Cycle Model Chart and Z-score
According to this model, the DJIA is in bubble territory, at least as far as historical cycles that were used to construct it. The model may be defective, or it may be revealing a severe anomaly in the markets, as occurred several times in the past which all resolved to the downside. To illustrate this point, I have placed a line at the current Z-score and extended to 1900. I look forward to the performance of the DJIA in December to resolve the issue.
Sunday, November 17, 2013
2013.11.15 Silver Cycle Model Chart
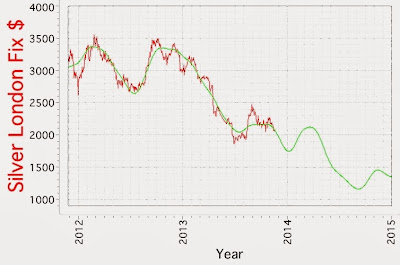
The silver cycle model continues to indicate lower prices for silver going into the end of the last quarter of 2013. I do not want to speculate on the reasons why the gold and silver cycle models are divergent in the 2014-2015 time frame. They are constructed and computed independently of each other. On the other hand, they have both been convergent in the short term, suggesting that going forward, if one of the models is "wrong" this should emerge as a major divergence with predicted price as we move into first quarter 2014.
Saturday, November 2, 2013
2013.11.01 XOI.X Cycle Chart
The XOI.X model suggests a continued rise in the index to 1850 +/- topping in mid-2014. For comparison purposes, the previous cycle model 2013.10.04 is shown below.
Subscribe to:
Comments (Atom)


