Econocasts

Sunday, December 16, 2018

2018.12.14 Silver Cycle Model Chart

2018.12.14 Silver cycle Model Chart


The silver cycle model is suggesting a rise in price with a local maximum in the first quarter of 2019.  The previous run of the model is shown below and here on the blog.


2018.07.20 Silver Cycle Model Chart

Saturday, December 8, 2018

2018.12.07 Gold Cycle Model Chart

2018.12.07 Gold Cycle Model Chart


The gold cycle model continues its right phase shift, but happily the model continues to converge. Much like 6 months ago, the model suggests the chance of a large price drop is small and the basing process continues unabated.  The previous run is shown below and here on the blog.  Note the change in the time and price axes.


2018.06.22 Gold cycle Model Chart

Sunday, November 25, 2018

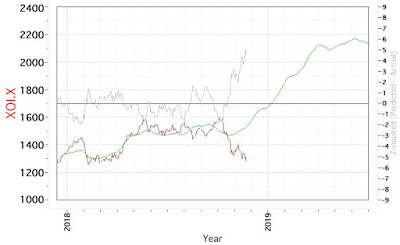
2018.11.25 XOI.X Cycle Model Chart

2018.11.25 XOI.X Cycle Model Chart


The model continues to converge, but there is a continuing right phase shift and a wide discrepancy between actual and predicted suggesting lower prices are much less probable. Note also the change in the right axis descriptors, as the maximum has decreased from 2800 to just under 2200.  A previous iteration of the model is shown below and here on the blog. 

A surrogate oil index, USO, remains on sell according to the medium term models, and has been on sell since 2018.10.04.  This suggests the right phase shift of the cycle model may continue for a while. 


2018.09.07 XOI.X Cycle Model Chart