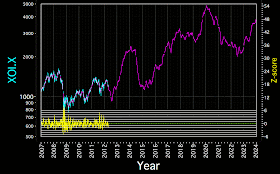
These cyclic structural models are not designed to be used as trading models. These models perform with less error on the time scale compared to the price scale, and are best interpreted by putting more credence in the turning points rather than actual prices. With that in mind, here is the long term DJIA model, which has been performing poorly as a short term indicator of market movements. When backtested at decadal time scales, the DJIA model still has some validity, so I am showing the chart which must, by necessity, include the shorter time scale parameters. There is always the possibility of a "6-sigma event" in terms of short-term model divergence, which will become apparent with time if true. The event itself may reflect the concerted effort of Western Central Banks to push forward the "Minsky Moment" by recursively capitalizing banks that have lost assets. Or, it could just be a lousy model.
Both gold and silver models are performing well in the short term, so it is interesting to look at the long term picture. I extended the time range to 2024 to capture the parallel behavior of the gold and DJIA models. To engage in a bit of fantasy - it makes a nice story that somewhere around 2016, instead of being issued as debt, large quantities of money are added to the world economy by concerted monetization of government held bonds. I could see the rise in gold and DJIA as a reflection of a Von Mises "crack-up boom." Thorsten Polleit has a nice essay on the subject.
I don't have any reasonable ideas regarding the divergence of gold and silver, however, these are just models so reality may intervene!
Visit econocasts.net for free sample trading model downloads.


Dear Paolo, thank you for you work. I am following your blog for some time. Silver and gold worked pretty well, Dow Jones not... I know you write that one should consider the models as a guide to possible turning points and not to accept the magnitude of the move. However I was thinking would it make sence to back test your Dow Jones and gold model in the way that you would make a model for Dow/Gold ratio alone? Does it make a sence for you. It could be another helpful tool. If you study this ratio it tends to keep in its 20-year log-channel from one extreme to the other one. I have nice charts, prehaps I can make them free on Stockcharts so you can see what I mean. Basically the "big picture"of historic movement you can see here: http://www.sharelynx.com/chartstemp/DowGoldRatio.php
ReplyDeleteI did some studies of each particular move between extremes and it seems that all the time stays the ratio within its channel (in log scale). I am looking forward for your answer. Thank you Sinuhet
Hi Sinuhet, I can see your point with regards to the Dow/Gold chart. I have never used the methodology on a ratio, so I will have to investigate what kind of statistical structure a ratio might exhibit that could cause analytic problems. If I find that it would be reasonable to make a cycle model out of the Gold/Dow derivative time series, I'll begin to work on it. These kinds of cycle models take me some time to put together, so it may be a few weeks to a few months before I know if it is possible. I'll post the progress in the blog page Blog Notes. Thank you for dropping in and especially for your input! - Paolo
ReplyDelete