Econocasts

Sunday, February 26, 2017

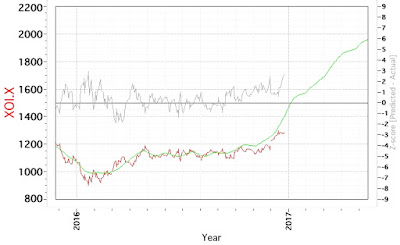
2017.02.24 XOI.X Cycle Model Chart

2017.02.24 XOI.X Cycle Model Chart


The XOI.X model predictive curve continues to shift to the right, and suggests that much lower prices are highly unlikely, while pressure is building for a rise going forwards.  Astute readers with good memories will realize this is the same analysis as provided from the model run about a month ago shown below. Also of note is that a medium term model of USO continues to remain in sell mode, as shown here.  A previous iteration of the model is shown below and here on the blog.


2017.02.01 XOI.X Cycle Model Chart
 

Saturday, February 11, 2017

2017.02.10 Silver Cycle Model Chart

2017.02.10 Silver Cycle Model Chart


The silver cycle model is performing well, and previously suggested a rise in price based on the inflection point at the beginning of 2017.  While there may be some continued right phase shift in the predictive curve, the model is calling for another inflection point in late Spring of 2017 which based on past performance could extend into Summer or early Fall.  A previous iteration of the model is shown below and here on the blog.


2016.12.30 Silver Cycle Model Chart

Sunday, February 5, 2017

2017.02.03 Gold Cycle Model Chart

2017.02.03 Gold Cycle Model Chart


The gold cycle model continues to predict higher prices for the metal going forwards.  The end of 2016 may have seen an inflection point if the model is valid.  Both the GDXJ and GLD medium-term trade models are aligned, as they have been in buy mode since the end of 2016, which lends additional support to the hypothesis. You can go to the medium term model out page on the link above or by clicking here. The medium-term models are updated on Fridays, and I will post any changes that occur on the weekend.  The previous gold cycle model is shown below and here on the blog.


2017.01.06 Gold Cycle Model Chart

Thursday, February 2, 2017

2017.02.01 XOI.X Cycle Model Chart

2017.02.01 XOI.X Cycle Model Chart


The XOI.X model predictive curve continues to shift to the right, and suggests that much lower prices are highly unlikely, while pressure is building for a rise going forwards.  That said, my medium-term trading model for USO went short on December 21, 2016 and continues short.  I update it on Fridays, so if it changes, I will post a comment here.  A previous iteration of the model is shown below.


2016.12.27 XOI.X Cycle Model Chart