|
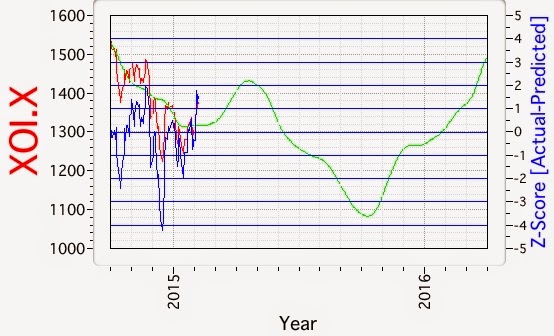
| 2015.02.20 Gold Cycle Model Chart |
The gold model Z-score increased to 2.4 from the previous iteration. This suggests increasing pressure for a reversal to the mean, in this case a rise towards the $1300 level. A reader asked how to interpret the Z-score, and in answer I have also posted a long term model ranging from 1968 to 2016.
If you click on the chart to get the higher resolution graphic, you will see that on a historical basis the Z-score has been >3 about a dozen times, out of 11909 data points in the time series. This is why in my last gold cycle model chart update I mentioned that it was unlikely that the model would breach a Z-score of 3. For convenience, I will also add the model to the long term chart section. However, it also becomes more likely that the model might fail to converge unexpectedly and annoyingly. According to the cycle model, we seem to be at a major turning point for gold, so we are in the "make or break" time for the model. Hence, I will try to keep weekly updates current.