 |
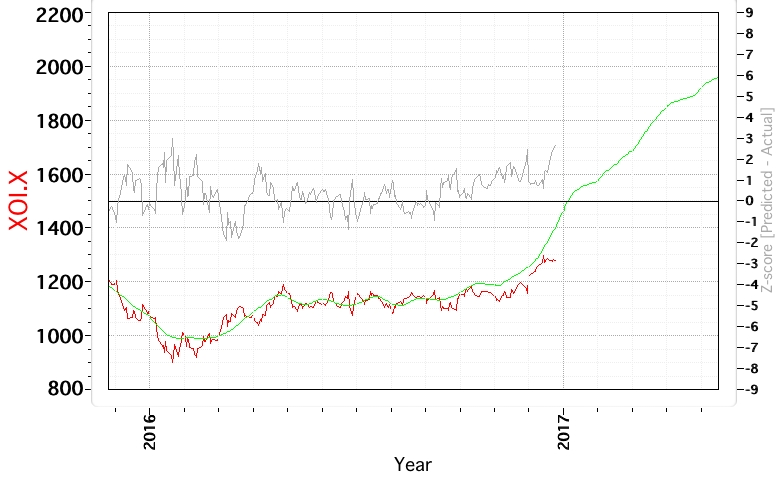
| 2016.12.27 XOI.X Cycle Model Chart |
The predictive curve shifted to the right, but the index also increased in magnitude so that that the Z-score is now much less than indicated in the previous month's chart. The previous iteration is shown below, which is also found here on the blog.
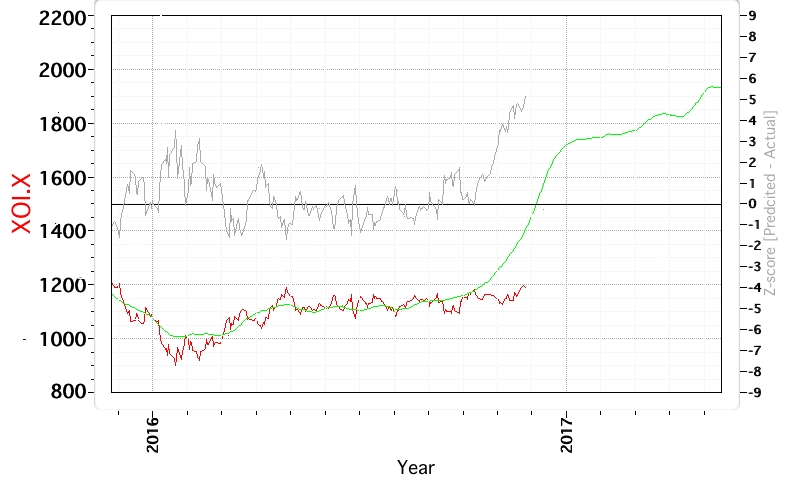 |
| 2016.11.26 XOI.X Cycle Model Chart |
4 comments:
Paolo,
Thank you for your work! Your model has been very good with oil but has a habit of shifting to the right. What drives this shift and is it possible to predict more or less likelihood of a shift? Merry Christmas!
Pedro
Hola Paolo,
What input drives the shift in the model to the right? do you anticipate that it will persist? Merry Christmas!
Pedro
Paolo,
Thank you for sharing your work. Your model has done a fantastic job with this energy cycle. I've noticed that your model has shifted to the right in the last few iterations. What is driving the shift? Do you expect it to continue?
Thank you,
Pedro
Hi Pedro, thanks for the interesting question.
I should define "phase shift" - which is when the predictive curve does not appreciably change in magnitude, but 'shifts' ahead in time compared to previous iterations. The shift occurs because there is error associated with the cycle parameters, one of which is phase, and by definition the model is minimizing overall error by adjusting the parameters. At some point, either the model catches up with reality, or the model breaks down, which usually means non-convergence.
These structural cycle models do not have any input except for the actual price data. Which is another way of admitting that unknown factors, an election, a bad winter, a new energy policy, etc. alter the actual price going forwards, and those factors are not taken into account by the cycle model that generates the predictive curve.
For short to intermediate trading, I use models that use not only the price level, but also the volume magnitude, and they are "free form" and not structured. Those models adapt to "unknown" factors related to trading behavior, but unfortunately, in such a model, the resulting formulas from the neural net are not easily interpreted by humans! Also, the unknown trading factors change with time, so that a neural net model that worked for data from a year ago may not work for current data, hence the need to constantly regenerate them.
The cycle models are much simpler, and only provide a long-range view of price levels, if they are valid.
Post a Comment